Project in Trouble?
GRAPHS TO THE RESCUE
Doug Auclair
for NCI, inc.
Washington, D.C.
The 4-slide Presentation
- Okay, what're we talkin' 'bout here?
- So, borin', amirite?
- The State of Graphs (at NCI)
- I can haz Linkies, plz
The Project/The Plan
- US Gov't project: Spreadsheet management
- The 'need': Okay, they don't know what they need
- The 'what they don't want': excitement
- What they got: DIS!
WHERE-D'AT, NCI?
- Project successes/progress:
- Gov't client: One delivery, on approved software list
- Commercial client: Our first, PoC-stage
- What we need, yo!
I CAN HAZ LINKIES?
- logicaltypes.com These slides
- twitter.com/geophf Daily Graph stock analysis at market close
- twitter.com/1HaskellADay Haskell problems/solutions; lotsa Data.Graph stuff
MORE THAN 4 PAGES
(What they had...)
(eww, spreadsheets, blah-bla-blah)
WHAT THEY GOT
(but under the covers)
(oooh! graphs!)
WHAT THEY GOT
WHAT THEY WANTED
(sigh, more spreadsheets)
(WITH the answers they needed, s'il vous plaît)
BUT THEY ALSO GOT
(sigh, spreadsheets)
(but showing data in ways they couldn't see before)
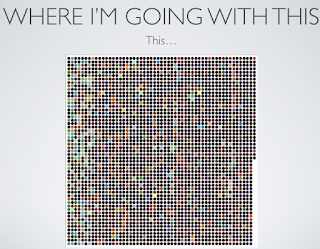
This...
Unclustered, but colorized-by-algorithm data
... to this
Clustered data, represented colored-by-datum, and expandable-on-demand nodes


No comments:
Post a Comment