- 2020-07-31: Well, that's random. Generating random numbers and sequences is today's #Haskell problem. Today's #haskell solution shows that I can (<*>) that monad, first go, without even looking it up or anything. So, yeah, I'm walking pretty tall right now.
- 2020-07-30: Kate and Shoaib are going on vacation. Commander Adama in Star Wars tells us that for today's #haskell problem, we are to "Make it so, Number one." And: there they go! Shoaib and Kate, going on a vacay, havin' fun, and type-safely, at that, because of the #haskell solution 'n stuff.
- 2020-07-29: "How many days until ...?" A date calculator for today's #haskell problem. When I say: "Compute the date," I'm not talking fig trees, here. The solution to today's #Haskell problem.

- 2020-07-28: Today's #haskell problem involves passing arguments to and verifying results from an external application. 'frankenfurters.' That's what we're trying to sum here. 'frankenfurters.' 'Fault Tolerance'? We've got that with today's #haskell solution.
- 2020-07-27: Today's #Haskell exercise makes us realize that ... "All, in all, you're just a ... nother brick in THE WALL. :/" A solution pour vous, s'il vous plaît.

- 2020-07-24: Today's #haskell problem explores the result of processed images from, in this case, Amazon's Rekognition. Today's #haskell solution: BIRDz! ... Cardinals, in fact.

- 2020-07-23: For today's #haskell problem, let's read in a JPG (o' FLAH'z!) and write it out as a TIFF ... for, you know, like: an image processing/classification exercise, at some later date. Ooh! TIFFY! TIFF saved from loaded JPEG image.

- 2020-07-22: For today's #haskell problem we extract data from JSON returned from a REST endpoint. The #haskell solution is declarative/functional-composition goodness to parse data from JSON returned from a REST endpoint.
- 2020-07-21: We ping a public API REST endpoint for today's #Haskell problem. For today's #haskell solution, simpleHttp in Network.HTTP.Conduit does the trick!
- 2020-07-20: For today's #haskell problem we read a file that contains a JSON message and parse it.
- 2020-07-17: Oops! Where has the time gone? That's today's ... I mean, YESTERDAY's, #haskell problem.

- 2020-07-16: And now, for something completely different: today's #haskell problem has us reading a file, parsing the data, and ranking the results. #haskell solution to which level is most recruit-efficient for a dark chest.
- 2020-07-15: For today's #haskell problem, we pull what we've done so far all together and compute today's pairings, given historical context.
- 2020-07-14: For today's #haskell problem, we pull what we've done so far all together and compute today's pairings, given historical context.
- 2020-07-14: For today's #Haskell problem, we look at using our historical context of pairings to answer questions for future pairings.
- 2020-07-13: Now that we've selected pairings for today, let's store those pairings into an historical context for today's #haskell problem.
- 2020-07-08: Pairing and ... 'Mobbing' (?) ... okay, really??? is our game for today's #haskell problem. A solution to the simple pairing-problem.
- 2020-07-07: For today's #haskell problem, we lay a foundation for building a team-pairing app. This day's problem addresses a History-type to provide context to the pairing-algorithm.
- 2020-07-06: For today's #haskell problem, we look at finding the spanning trees of a graph.

- 2020-07-02: Today's #haskell exercise finds us (acyclic) pathing though a simpler, yet-not-fully connected, graph.

- 2020-07-01: For today's #haskell problem we find cycles in graphs, ... MOTORcycles in graphs! AHA! AND MAKE MINE A DUCATI! ON FYE-YARRRR! 🔥 ... no ... wait ... Oh, well. #GraphTheory

Showing posts with label graph theory. Show all posts
Showing posts with label graph theory. Show all posts
Thursday, July 2, 2020
July 2020 1HaskellADay Problems and Solutions





June 2020 1HaskellADay Problems and Solutions


Thursday, February 4, 2016
Graphing with Goats
Slides, presented comme ça! Links at the end. Presentation posted on youtube of the meetup.


1

2

3 (I am known for teh kittehs)

4 (graphs-я-borin' is another talk I gave at SanFran GraphConnect 2015)

5. The Beach (not Plastic)

6

7

8. ACID means something very important to DBMSes(eses)(eses)


(geddit? links to linkurio.us? geddit?)

11. "sed-butt, sed-butt, sed-butt" my daughters chant around the house all day
Now: Graph-applications:

12. Social Media

13. The Markets

14. The Markets (again) / Managing Complexity

15. Search / (Fraud) Detection
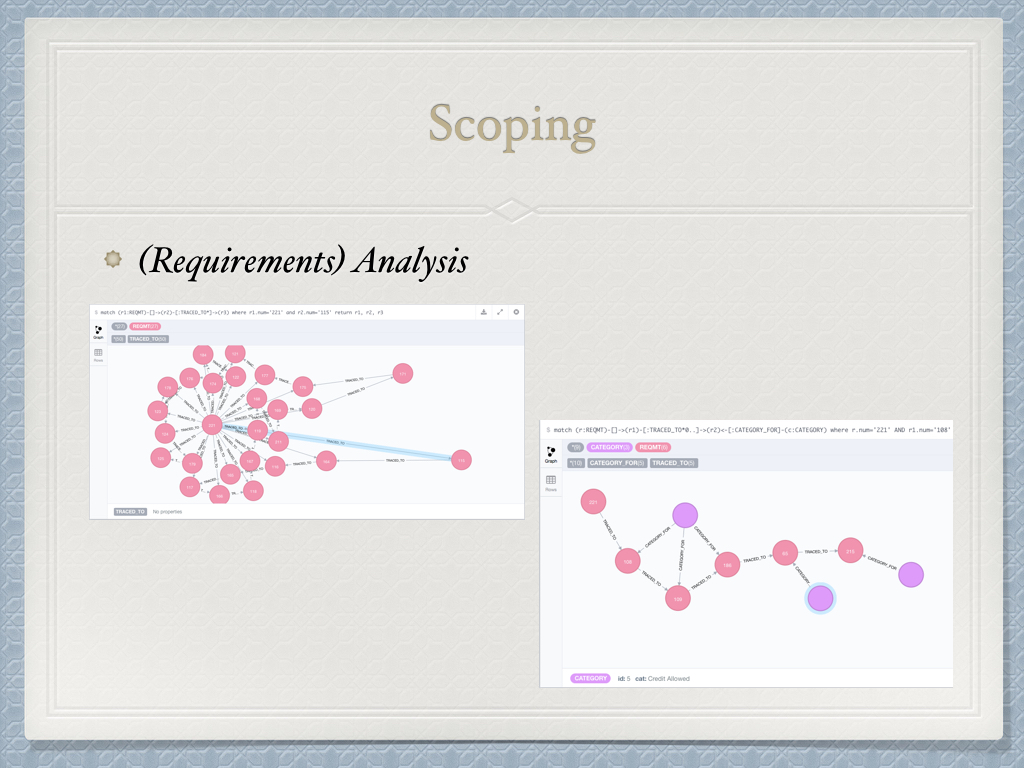
16. Scoping / (Requirements) Analysis

17. Clustering

18. Errybody say: "YAAAAAAYYYYYY!"

19. Links, en-text-ified:
- What is a Graph? from neo4j.com
- Regressive Imagery Dictionary-as-Graph (yours truly)
- Goats (because reasons)
- grapheneDB.com (DaaS)
- linkurio.us / d3js.org
- @1HaskellADay
- Daily Haskell problem; sometimes Graph (Theory)-related
- Yeah, links to themselves. Yeah.
- Amino Acid CODON table
- data: http://lpaste.net/raw/3763369603112108032
- problem statement: http://lpaste.net/6606149825735950336

20. Buh-bay!
Wednesday, October 21, 2015
GraphConnect Lightning Talk: Project Planning Troubles? Graph Theory to the Rescue!

Project in Trouble?
GRAPHS TO THE RESCUE
Doug Auclair
for NCI, inc.
Washington, D.C.

The 4-slide Presentation
- Okay, what're we talkin' 'bout here?
- So, borin', amirite?
- The State of Graphs (at NCI)
- I can haz Linkies, plz
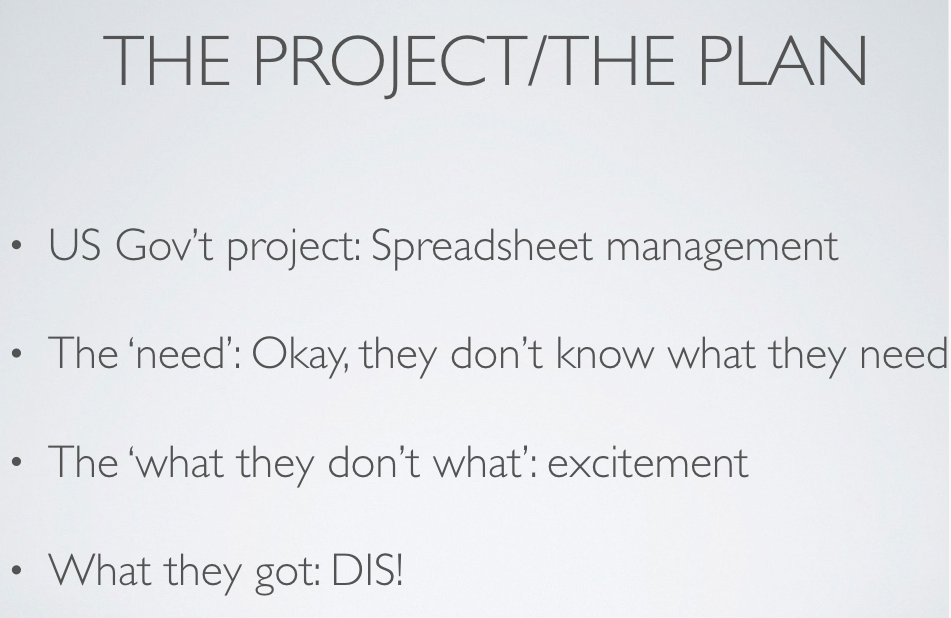
The Project/The Plan
- US Gov't project: Spreadsheet management
- The 'need': Okay, they don't know what they need
- The 'what they don't want': excitement
- What they got: DIS!

WHERE-D'AT, NCI?
- Project successes/progress:
- Gov't client: One delivery, on approved software list
- Commercial client: Our first, PoC-stage
- What we need, yo!

I CAN HAZ LINKIES?
- logicaltypes.com These slides
- twitter.com/geophf Daily Graph stock analysis at market close
- twitter.com/1HaskellADay Haskell problems/solutions; lotsa Data.Graph stuff

MORE THAN 4 PAGES
(What they had...)
(eww, spreadsheets, blah-bla-blah)

WHAT THEY GOT
(but under the covers)
(oooh! graphs!)

WHAT THEY GOT
WHAT THEY WANTED
(sigh, more spreadsheets)
(WITH the answers they needed, s'il vous plaît)

BUT THEY ALSO GOT
(sigh, spreadsheets)
(but showing data in ways they couldn't see before)

This...
Unclustered, but colorized-by-algorithm data

... to this
Clustered data, represented colored-by-datum, and expandable-on-demand nodes
Thursday, August 13, 2015
Uploading Data to GrapheneDB
Today.
We look at how to upload a set of data (potentially massive) to GrapheneDB. I say '(potentially massive)' because an option, of course, is to enter Cypher, line-by-line in the Neo4J web admin interface, but this becomes onerous when there are larger data sets with complex (or, strike that, even 'simple') relations.
An ETL-as-copy-paste is not a solution for the long term, no matter how you slice it (trans: no matter for how long you have that intern).
So, let's look at a viable long-term solution using a specific example.
Let's do this.
The Data
The data is actually a problem in and of itself, as it is the set of Top 5 securities by group, and it is reported by various outlets, but the reports are (deeply) embedded into ((very) messy) HTML, in the main, or have a nice, little fee attached to them if you want to tap into a direct feed.
As I'm a start-up, I have more time than money (not always true for all start-ups, but that's a good rule of thumb for this one), so, instead of buying a subscription to the top 5s-feed, I built an HTML-scraper in Haskell to download the sets of Top 5s. Scraping HTML is not in the scope of this article, so if you wish to delve into that topic, please review Tagsoup in all its glory.
Okay, prerequisite,
Next, I save the data locally. I suppose I could go into a database instance, such as MySQL, but for now, I have only 50 or so days worth of data, which I'm happily managing in a file and a little map in memory.
Okay, so we have scraped data, automatically stored away for us. What does it all mean? That's when I got the idea of having a way of visualizing and querying these data. Neo4J was a fit, and GrapheneDB, being DaaS (you just have to need to know that 'DaaS' means 'Data as a Service'), makes sense for collaborating as a geographically-dispersed team.
Two Options
So, how do I get the data there? Two options that we explored. One was to load the data into a local neo4j-instance and then snap-restore in the Cloud with that image. That works, the first time, but it seems to me to be rather ponderous, as this is a daily process, and I do not wish to replicate my database locally daily and snap restore to the Cloud. So, I chose the latter option, which was to build a system that takes the local map, translate that into Cypher queries (to save as graph nodes and edges), then translate those Cypher queries into JSON, then create a web client that ships that JSON-of-Cypher-queries over the wire to the targeted web service.
... Neo4J and GrapheneDB are web services that allow REST data queries... (very) helpful, that.
Okay, this is not going to be a Cypher tutorial. And this is not going to be the Cypher you like. I have my Cypher, you have yours, critique away. Whatevs. Let's get on with it.
The data is of the following structure, as you saw above:
Date -> { ("Mkt_Cap", ([highs], [lows])), ("Price", ([highs], [lows])), ("Volume", [leaders]) }
And we wish to follow this structure in our graph-relational data. Let's look at the top-tier of the data-structure:

You see I've also added a 'Year'-node. I do this so I can anchor around a locus of days if I wish to explore data across a set of days.
So, okay, from there, do I then create grouping nodes of 'leaders' and 'losers' for the categorization of stocks? This gets into the data-modelling question. I chose to label the relations to the stocks as such instead of creating grouping nodes. There're tradeoffs in these modeling decisions, but I'm happy with the result:

The module that converts the internal data structures is named Analytics.Trading.Web.Upload.Cypher. Looking at that module you see it's very MERGE-centric. Why? Here's why:

What you see here is that symbols, such as, well, primarily $AAPL, and others like $T and $INTC find themselves on the Top 5s lists, over and over again. By using MERGE we make sure the symbol is created if this is its first reference, or linked-to if we've seen it before in this data set.
In this domain, MERGE and I are like this: very close friends.
Okay, Map-to-Cypher, it's a very close ... well, mapping, because the relational calculus and domain-to-co-domain-mappings have a high correspondence.
I'm at a 'disadvantage' here: I come to functional programming from a Prolog-background: I think functional data structures relationally, so, usually, mappings of my functional data structures fall very nicely into graphs.
I don't know how to help you with your data structures, especially if you've been doing the Java/SQL object/relation-mapping stuff using JPA ... I mean, other than saying: 'Switch to ... Haskell?' Sorry.
Okay, so we have a set of Cypher queries, grouped in the following structures:
Date -> [groups] where groups are Mkt_Cap, Volume, and Price
Then, for each group for that date
group -> Leader [symbols] -> Losers [symbol]
So we have (with the three groups), four sets of Cypher queries, each of the grouped Cypher query weighing in with thirty MERGE statements each (three MERGE statements for each stock symbol node). Not bad.
How do we convert this list of grouped Cypher queries into JSON that Neo4J understands?
Two things make this very easy.


After I got that feel-good confirmation in the small, I simply switched the URL from localhost:7474 to the URL GrapheneDB provides in the "Connection" tab, and voilà: we have data here!

(lots of it!)
LOLSweet!
We look at how to upload a set of data (potentially massive) to GrapheneDB. I say '(potentially massive)' because an option, of course, is to enter Cypher, line-by-line in the Neo4J web admin interface, but this becomes onerous when there are larger data sets with complex (or, strike that, even 'simple') relations.
An ETL-as-copy-paste is not a solution for the long term, no matter how you slice it (trans: no matter for how long you have that intern).
So, let's look at a viable long-term solution using a specific example.
Let's do this.
The Data
The data is actually a problem in and of itself, as it is the set of Top 5 securities by group, and it is reported by various outlets, but the reports are (deeply) embedded into ((very) messy) HTML, in the main, or have a nice, little fee attached to them if you want to tap into a direct feed.
As I'm a start-up, I have more time than money (not always true for all start-ups, but that's a good rule of thumb for this one), so, instead of buying a subscription to the top 5s-feed, I built an HTML-scraper in Haskell to download the sets of Top 5s. Scraping HTML is not in the scope of this article, so if you wish to delve into that topic, please review Tagsoup in all its glory.
Okay, prerequisite,
Step 0. scraped data from HTML: done (without explanation. Deal.)
Next, I save the data locally. I suppose I could go into a database instance, such as MySQL, but for now, I have only 50 or so days worth of data, which I'm happily managing in a file and a little map in memory.
Step 1. store data we care about locally: done
Okay, so we have scraped data, automatically stored away for us. What does it all mean? That's when I got the idea of having a way of visualizing and querying these data. Neo4J was a fit, and GrapheneDB, being DaaS (you just have to need to know that 'DaaS' means 'Data as a Service'), makes sense for collaborating as a geographically-dispersed team.
Two Options
So, how do I get the data there? Two options that we explored. One was to load the data into a local neo4j-instance and then snap-restore in the Cloud with that image. That works, the first time, but it seems to me to be rather ponderous, as this is a daily process, and I do not wish to replicate my database locally daily and snap restore to the Cloud. So, I chose the latter option, which was to build a system that takes the local map, translate that into Cypher queries (to save as graph nodes and edges), then translate those Cypher queries into JSON, then create a web client that ships that JSON-of-Cypher-queries over the wire to the targeted web service.
... Neo4J and GrapheneDB are web services that allow REST data queries... (very) helpful, that.
Step 2. Translate the local data to Cypher queries
Okay, this is not going to be a Cypher tutorial. And this is not going to be the Cypher you like. I have my Cypher, you have yours, critique away. Whatevs. Let's get on with it.
The data is of the following structure, as you saw above:
Date -> { ("Mkt_Cap", ([highs], [lows])), ("Price", ([highs], [lows])), ("Volume", [leaders]) }
And we wish to follow this structure in our graph-relational data. Let's look at the top-tier of the data-structure:

You see I've also added a 'Year'-node. I do this so I can anchor around a locus of days if I wish to explore data across a set of days.
So, okay, from there, do I then create grouping nodes of 'leaders' and 'losers' for the categorization of stocks? This gets into the data-modelling question. I chose to label the relations to the stocks as such instead of creating grouping nodes. There're tradeoffs in these modeling decisions, but I'm happy with the result:

The module that converts the internal data structures is named Analytics.Trading.Web.Upload.Cypher. Looking at that module you see it's very MERGE-centric. Why? Here's why:

What you see here is that symbols, such as, well, primarily $AAPL, and others like $T and $INTC find themselves on the Top 5s lists, over and over again. By using MERGE we make sure the symbol is created if this is its first reference, or linked-to if we've seen it before in this data set.
In this domain, MERGE and I are like this: very close friends.
Okay, Map-to-Cypher, it's a very close ... well, mapping, because the relational calculus and domain-to-co-domain-mappings have a high correspondence.
I'm at a 'disadvantage' here: I come to functional programming from a Prolog-background: I think functional data structures relationally, so, usually, mappings of my functional data structures fall very nicely into graphs.
I don't know how to help you with your data structures, especially if you've been doing the Java/SQL object/relation-mapping stuff using JPA ... I mean, other than saying: 'Switch to ... Haskell?' Sorry.
Okay, so we have a set of Cypher queries, grouped in the following structures:
Date -> [groups] where groups are Mkt_Cap, Volume, and Price
Then, for each group for that date
group -> Leader [symbols] -> Losers [symbol]
So we have (with the three groups), four sets of Cypher queries, each of the grouped Cypher query weighing in with thirty MERGE statements each (three MERGE statements for each stock symbol node). Not bad.
How do we convert this list of grouped Cypher queries into JSON that Neo4J understands?
Two things make this very easy.
- The JSON-structure that Neo4J accepts is very simple, it is simply a group of "statements" which are individuated into single Cypher-"statement" elements. Very simple JSON! (thank you, Neo4J!)
- There is a module in Haskell, Data.Aeson, that facilitates converting from data structures in Haskell into JSON-structure, so the actual code to convert the Cypher queries reduces to three definitions:

With that, we have Cypher queries packaged up in JSON.
Step 3: SHIP IT!So now that we have our data set, converted to Cypher, and packaged as JSON, we want to send it to GrapheneDB. Before I went right to that database (I could have, but I didn't), I tested my results on a Neo4J instance running on my laptop, ran the rest call and verified the results. BAM! It worked for the one day I uploaded.

After I got that feel-good confirmation in the small, I simply switched the URL from localhost:7474 to the URL GrapheneDB provides in the "Connection" tab, and voilà: we have data here!

(lots of it!)
Step n: Every daySo now that I have the back-data uploaded, I just simply run my scraper->ETL-over-REST->GrapheneDB little system and I have up-to-the-day Top 5s stock securities for my analysis, on the Cloud.
LOLSweet!
Wednesday, August 12, 2015
(Pure) Functional Programming Claims IRL
So, THIS happened:

So, does functional programming stack up in the real world? In industry?
Yes. Check my linkin profile. I have been programming, in industry, as long as you have been alive.
Here are some (pure) functional programming examples to back up this claim, because academics can talk all they want, but they are not in there, in the trenches, with you where it counts.
I am, because I happened to have dug a few of those trenches. You're welcome.
Case study 1: ATS-L
Worked on a project in DHS called 'ATS' ('Automated Targeting System'). The existing system ATS-C was a 100,000-line Prolog behemoth that used pure dynamic types (no type hints, nor boxed types) and every rule started with an assert and ended with a retract. And 100,000 lines.
It was impossible to know what was going on in that system, without running the code in the debugger and pulling from the dynamic environment. Consequently, the ATS-C guy had (still has) job security. Not his aim, but that is a nice plus.
It took us 72-hours to go through every line of his code to correct the Int-rollover problem when the primary key exceeded two billion for the index.
So, I was called in to 'help.' HA! But then eventually I built ATS-L. I wrote it in 10,000 lines of purely functional Prolog (yes, that is possible to do, and remain authentic to logic programming in Prolog), so every rule called gave the same truth-verification from the same set of arguments, every time.
Shocker! I know.
I had the same level of functionality of ATS-C and handled 1,000x the number of transactions per hour. And as it was purely functional Prolog, I could reason about my program in the large and in the small. Importantly, so could others, as I passed on that work after maintaining it for three years.
In short: 1/10th the SLOC with the same level of functionality with increased real-time responsiveness and a vastly reduced level of maintenance.
Oh, and I also wrote 726 unit tests and put them on an automated midnight run, generating a report every single day. If my system broke, or something changed, I knew it, and management knew it when the report was automatically emailed to them.
Case Study 2: CDDS
Worked three years in Fannie Mae devising within a team an appraisal review process, CDDS. We had a good team of five engineers and I was given the 'Sales Comparison Approach' which had 600 elements out of 2,100 data elements in over 100 data tables, one of the tables ingested 100 million elements per month. All the elements were optional. All of them, so primary key dependencies were an ... interesting problem. The upshot was that Sales Comparison Approach was an impossible task to code, as we coded it in Java, of course.
What did I do? I coded it in Java.
After I implemented the Maybe type, then the Monad type-class ... in Java.
After I completed the system and tuned it, storing only the values that were present in the submitted forms, my manager reported up the chain that SCA and CDDS would have failed if I had not been there to implement it.
How did I implement it? In Java. I didn't use one for-loop and my if-statements were not there. I used the Maybe-Monad to model semi-determinism, lifting the present data to Just x and the absent data ('null') to Nothing, and then I executed action against the monadic data.
Simple. Provable. Implemented. Done.
Oh, and I had written 1,000 of the 1,100 unit test cases. SCA had 1,000 unit test cases, the rest of the system had a total of 100 unit test cases.
My code coverage was fiiiiiiine.
Case Study 3: Sunset Dates
This one was interesting.
I worked at Freddy Mac for a year, and they had a problem, and that problem was to calculate the sunset date for a mortgage based on the most recent date from one of possibly five indicators, that changed with each possible mortgage transaction.
Three different software teams tackled this problem over a period of six months and none of them implemented a system that passed UAT.
I sat down with the UATester and kept getting part of the story. I lifted our conversations up into the categorical domain, and then dropped that into a Java-implementation (I used both monads and comonads which I had implemented).
It took me two solid months working with this tester and a front-end developer, but we passed UAT and we got the customer and their SMA to sign off on it.
Three person team, purely functional programming ... in Java won that work where standard imperative approaches failed, over and over again.
Funny story. I was seriously asked on that project: "What's a tuple?"
Case Study 4: Dependency Graphs of Program Requirements ('TMQER')
I can't compare what I wrote, in Haskell, to an alternative system, because the alternative, traditional imperative approach was never essayed. We had a set of 521 requirements for a program with many (multiple) parent and child dependencies, so it wasn't a tree, it was a graph. So, I parsed the requirements document into a Haskell Data.Graph and provided not only a distance matrix, as requested (which is not what the customer wanted at all: it was just what they said and thought they wanted), but also clustering reports of which requirements were the 'heaviest' having the most dependencies and which requirements were show-stoppers to how many follow-on requirements.
Then I uploaded my Haskell Graph into Neo4J, making heavily-clustered requirements an obvious visual cue. And we won that contract.
The project wasn't attempted in Java. The project was attempted in R, and it couldn't be done. They estimated the graph manipulation algorithm would be 200-lines of code in R, that they couldn't get working.
With comonads, I did it in one line of Haskell. One line for a graph deforestation algorithm to get to the bare essentials of what was important to the project. Wanna see it?

How hard was that? In Haskell, a pure functional programming language, not hard at all.
Not only that, that we won a contract that our competing companies said was impossible, but our VP got wind of this and started vetting my tech to other companies.
We have a contract in the works, right now, using Haskell and Neo4J on AWS that is answering questions about fuzzy relations in social networks that a company that is expert in social engineering needs us to answer.
And I can answer these questions using graph theory and purely functional programming.
Case study 5: the one that got away
Oh, and then there was the one that got away. It had to do with a neural network I built in Mercury, a purely functional logic programming language with Prolog-like syntax that was able to classify images into 'interesting' and (mostly) 'not-interesting' but 'interesting' had very specific, different meanings, and it was able to classify these images, using a pulse-coupled neural network, in ways that eliminated 99% of waste images quickly so that analysts could concentrate on doing work, as opposed to sieving through the deluge of useless images to get the the ones they needed to see.
I build a working prototype and demoed it.
This had never been done before. Ever.
Then, a Big Six came in and said, 'we can do that for you with 250 programmers and Java' and stole the project. After ten years and billions of dollars, they were unable to reproduce my work.
Pure Functional Programming Claims IRL
So, let's do a real-money tally.
ATS-L in one month, in the three years I maintained it (it is still up and running ten years later, ladies and gentlemen) made $26 million dollars in seizures and rescued three teens being human-trafficked over the border.
CDDS has been in production since the year 2010 and has verified appraisals helping Fannie Mae to make 62 Billion dollars in net profit in one quarter the year it went live, actually contributing to the rescue of Fannie Mae from insolvency.
TMQER has rescued a government run program from failure that has the funding price-tag of over 100 Million dollars of Government (your) taxpayer (your) money. You're welcome.
Sunset dates I wish I had a dollar amount, but you can estimate for me: three teams of business analysts and software engineers over a six month period said it couldn't be done (or tried it and failed). I scrapped all that code, wrote the system from first principals (Category Theory) and got it working and approved in two months. You do the math.
... Oh, and then there's my current project. I might actually be able to own this thing. Hmmmm.
So, yes, Virginia,
1. there is a Santa Clause
2. those academics are actually onto something. (Pure) functional programming actually does matter. It actually does allow you to program better, faster and more cleanly, and with these enhanced skill-sets you become the one they turn to when other teams throw up their hands at an 'impossible' task. And then you deliver, ahead of expectations on both time to deliver and budget costs.
Hm.

– question from a young programmer
So, does functional programming stack up in the real world? In industry?
Yes. Check my linkin profile. I have been programming, in industry, as long as you have been alive.
Here are some (pure) functional programming examples to back up this claim, because academics can talk all they want, but they are not in there, in the trenches, with you where it counts.
I am, because I happened to have dug a few of those trenches. You're welcome.
Case study 1: ATS-L
Worked on a project in DHS called 'ATS' ('Automated Targeting System'). The existing system ATS-C was a 100,000-line Prolog behemoth that used pure dynamic types (no type hints, nor boxed types) and every rule started with an assert and ended with a retract. And 100,000 lines.
It was impossible to know what was going on in that system, without running the code in the debugger and pulling from the dynamic environment. Consequently, the ATS-C guy had (still has) job security. Not his aim, but that is a nice plus.
It took us 72-hours to go through every line of his code to correct the Int-rollover problem when the primary key exceeded two billion for the index.
So, I was called in to 'help.' HA! But then eventually I built ATS-L. I wrote it in 10,000 lines of purely functional Prolog (yes, that is possible to do, and remain authentic to logic programming in Prolog), so every rule called gave the same truth-verification from the same set of arguments, every time.
Shocker! I know.
I had the same level of functionality of ATS-C and handled 1,000x the number of transactions per hour. And as it was purely functional Prolog, I could reason about my program in the large and in the small. Importantly, so could others, as I passed on that work after maintaining it for three years.
In short: 1/10th the SLOC with the same level of functionality with increased real-time responsiveness and a vastly reduced level of maintenance.
Oh, and I also wrote 726 unit tests and put them on an automated midnight run, generating a report every single day. If my system broke, or something changed, I knew it, and management knew it when the report was automatically emailed to them.
Case Study 2: CDDS
Worked three years in Fannie Mae devising within a team an appraisal review process, CDDS. We had a good team of five engineers and I was given the 'Sales Comparison Approach' which had 600 elements out of 2,100 data elements in over 100 data tables, one of the tables ingested 100 million elements per month. All the elements were optional. All of them, so primary key dependencies were an ... interesting problem. The upshot was that Sales Comparison Approach was an impossible task to code, as we coded it in Java, of course.
What did I do? I coded it in Java.
After I implemented the Maybe type, then the Monad type-class ... in Java.
After I completed the system and tuned it, storing only the values that were present in the submitted forms, my manager reported up the chain that SCA and CDDS would have failed if I had not been there to implement it.
How did I implement it? In Java. I didn't use one for-loop and my if-statements were not there. I used the Maybe-Monad to model semi-determinism, lifting the present data to Just x and the absent data ('null') to Nothing, and then I executed action against the monadic data.
Simple. Provable. Implemented. Done.
Oh, and I had written 1,000 of the 1,100 unit test cases. SCA had 1,000 unit test cases, the rest of the system had a total of 100 unit test cases.
My code coverage was fiiiiiiine.
Case Study 3: Sunset Dates
This one was interesting.
I worked at Freddy Mac for a year, and they had a problem, and that problem was to calculate the sunset date for a mortgage based on the most recent date from one of possibly five indicators, that changed with each possible mortgage transaction.
Three different software teams tackled this problem over a period of six months and none of them implemented a system that passed UAT.
I sat down with the UATester and kept getting part of the story. I lifted our conversations up into the categorical domain, and then dropped that into a Java-implementation (I used both monads and comonads which I had implemented).
It took me two solid months working with this tester and a front-end developer, but we passed UAT and we got the customer and their SMA to sign off on it.
Three person team, purely functional programming ... in Java won that work where standard imperative approaches failed, over and over again.
Funny story. I was seriously asked on that project: "What's a tuple?"
Case Study 4: Dependency Graphs of Program Requirements ('TMQER')
I can't compare what I wrote, in Haskell, to an alternative system, because the alternative, traditional imperative approach was never essayed. We had a set of 521 requirements for a program with many (multiple) parent and child dependencies, so it wasn't a tree, it was a graph. So, I parsed the requirements document into a Haskell Data.Graph and provided not only a distance matrix, as requested (which is not what the customer wanted at all: it was just what they said and thought they wanted), but also clustering reports of which requirements were the 'heaviest' having the most dependencies and which requirements were show-stoppers to how many follow-on requirements.
Then I uploaded my Haskell Graph into Neo4J, making heavily-clustered requirements an obvious visual cue. And we won that contract.
The project wasn't attempted in Java. The project was attempted in R, and it couldn't be done. They estimated the graph manipulation algorithm would be 200-lines of code in R, that they couldn't get working.
With comonads, I did it in one line of Haskell. One line for a graph deforestation algorithm to get to the bare essentials of what was important to the project. Wanna see it?

How hard was that? In Haskell, a pure functional programming language, not hard at all.
Not only that, that we won a contract that our competing companies said was impossible, but our VP got wind of this and started vetting my tech to other companies.
We have a contract in the works, right now, using Haskell and Neo4J on AWS that is answering questions about fuzzy relations in social networks that a company that is expert in social engineering needs us to answer.
And I can answer these questions using graph theory and purely functional programming.
Case study 5: the one that got away
Oh, and then there was the one that got away. It had to do with a neural network I built in Mercury, a purely functional logic programming language with Prolog-like syntax that was able to classify images into 'interesting' and (mostly) 'not-interesting' but 'interesting' had very specific, different meanings, and it was able to classify these images, using a pulse-coupled neural network, in ways that eliminated 99% of waste images quickly so that analysts could concentrate on doing work, as opposed to sieving through the deluge of useless images to get the the ones they needed to see.
I build a working prototype and demoed it.
This had never been done before. Ever.
Then, a Big Six came in and said, 'we can do that for you with 250 programmers and Java' and stole the project. After ten years and billions of dollars, they were unable to reproduce my work.
Pure Functional Programming Claims IRL
So, let's do a real-money tally.
ATS-L in one month, in the three years I maintained it (it is still up and running ten years later, ladies and gentlemen) made $26 million dollars in seizures and rescued three teens being human-trafficked over the border.
CDDS has been in production since the year 2010 and has verified appraisals helping Fannie Mae to make 62 Billion dollars in net profit in one quarter the year it went live, actually contributing to the rescue of Fannie Mae from insolvency.
TMQER has rescued a government run program from failure that has the funding price-tag of over 100 Million dollars of Government (your) taxpayer (your) money. You're welcome.
Sunset dates I wish I had a dollar amount, but you can estimate for me: three teams of business analysts and software engineers over a six month period said it couldn't be done (or tried it and failed). I scrapped all that code, wrote the system from first principals (Category Theory) and got it working and approved in two months. You do the math.
... Oh, and then there's my current project. I might actually be able to own this thing. Hmmmm.
So, yes, Virginia,
1. there is a Santa Clause
2. those academics are actually onto something. (Pure) functional programming actually does matter. It actually does allow you to program better, faster and more cleanly, and with these enhanced skill-sets you become the one they turn to when other teams throw up their hands at an 'impossible' task. And then you deliver, ahead of expectations on both time to deliver and budget costs.
Hm.
Monday, June 29, 2015
Tabular and Visual Representations of Data using Neo4J
Corporate and Employee Relationships
Both Graphical and Tabular Results
So, there are many ways to view data, and people may have different needs for representing that data, either for visualization (in a graph:node-edges-view) or for tabulation/sorting (in your standard spreadsheet view).
So, can Neo4J cater to both these needs?
Yes, it can.
Scenario 1: Relationships of owners of multiple companies
Let's say I'm doing some data exploration, and I wish to know who has interest/ownership in multiple companies? Why? Well, let's say I'm interested in the Peter-Paul problem: I want to know if Joe, who owns company X is paying company Y for whatever artificial scheme to inflate or to deflate the numbers of either business and therefore profit illegally thereby.
Piece of cake. Neo4J, please show me the owners, sorted by the number of companies owned:
MATCH (o:OWNER)--(p:PERSON)-[r:OWNS]->(c:CORP)
RETURN p.ssn AS Owner, collect(c.name) as Companies, count(r) as Count
ORDER BY Count DESC

Diagram 1: Owners by Company Ownership
Boom! There you go. Granted, this isn't a very exciting data set, as I did not have many owners owning multiple companies, but there you go.
What does it look like as a graph, however?
MATCH (o:OWNER)--(p:PERSON)-[r:OWNS]->(c:CORP)-[:EMPLOYS]->(p1)
WHERE p.ssn in [2879,815,239,5879]
RETURN o,p,c,p1

Diagram 2: Some companies with multiple owners
To me, this is a richer result, because it now shows that owners of more than one company sometimes own shares in companies that have multiple owners. This may yield interesting results when investigating associates who own companies related to you. This was something I didn't see in the tabular result.
Not a weakness of Neo4J: it was a weakness on my part doing the tabular query. I wasn't looking for this result in my query, so the table doesn't show it.
Tellingly, the graph does.
Scenario 2: Contract-relationships of companies
Let's explore a different path. I wish to know, by company, the contractual-relationships between companies, sorted by companies with the most contractual-relationships on down. How do I do that in Neo4J?
MATCH (c:CORP)-[cc:CONTRACTS]->(c1:CORP)
RETURN c.name as Contractor, collect(c1.name) as Contractees, count(cc) as Count
ORDER BY Count DESC

Diagram 3: Contractual-Relationships between companies
This is somewhat more fruitful, it seems. Let's, then, put this up into the graph-view, looking at the top contractor:
MATCH (p:PERSON)--(c:CORP)-[:CONTRACTS*1..2]->(c1:CORP)--(p1:PERSON)
WHERE c.name in ['YFB']
RETURN p,c,c1,p1

Diagram 4: Contractual-Relationships of YFB
Looking at YFB, we can see contractual-relationships 'blossom-out' from it, as it were, and this is just immediate, then distance 1 from that out! If we go out even just distance 1 more in the contracts, the screen fills with employees, so then, again, you have the forest-trees problem where too much data is hiding useful results with data.
Let's prune these trees, then. Do circular relations appear?
MATCH (c:CORP)-[:CONTRACTS*1..5]->(c1:CORP) WHERE c.name in ['YFB'] RETURN c,c1

Diagram 5: Circular Relationship found, but not in YFB! Huh!
Well, would you look at that. This shows the power of the visualization aspect of graph databases. I was examining a hot-spot in corporate trades, YFB, looking for irregularities there. I didn't find any, but as I probed there, a circularity did surface in downstream, unrelated companies: the obvious one being between AZB and MZB, but there's also a circular-relationship that becomes apparent starting with 4ZB, as well. Yes, this particular graph is noisy, but it did materialize an interesting area to explore that may very well have been overlooked with legacy methods of investigation.
Graph Databases.
BAM.
Subscribe to:
Posts (Atom)